Use Flodesk’s connector to pull a defined reporting period, compare clicks and check the source totals before choosing what to send next. The dashboard in my recording was generated quickly after connection. A trustworthy report also needs its date range and metric definitions.
I connected my Flodesk account to Claude and it showed me the truth about my email metrics that I had no idea about.
No spreadsheet. No code. Ninety seconds later I had a dashboard that actually tells me what my numbers mean — in plain English. And it caught one metric that had been lying to me for months.
It changed which emails I send, and which days I send them on.
Here's exactly how to do it yourself.
How to connect Flodesk to Claude
The whole setup lives in Claude's connectors. In the desktop app you go to customise → connectors, hit browse connectors, type Flodesk, and sign in. That's it — no API keys, no middleware, no Zapier in between.
The recorded demonstration used analytics tools. The connector now also supports limited subscriber management, so it is not universally read-only. Flodesk’s official guide, reviewed 15/09/2026, lists current tools and setup. Keep this dashboard task limited to reading data.
If you've never set up a connector before, my walkthrough on Claude connectors for Gmail and calendar covers the same steps for other tools — the pattern is identical.
Ask Claude what it can actually do
Here's the move most people miss. Instead of guessing what the connector can do, just ask it.
I typed: "Hey Claude, can you tell me in plain English what tools you have available with your Flodesk connector, and what we can do with this stuff?"
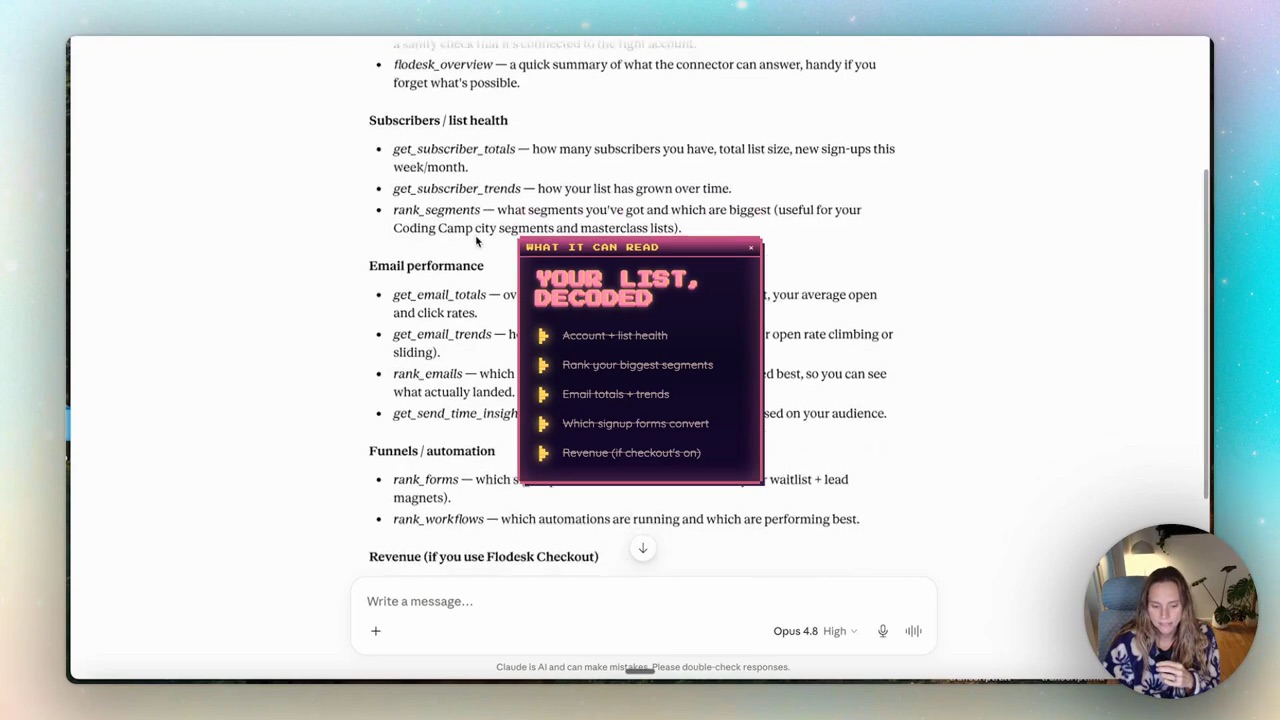
Within seconds it came back with the full list: account profile, subscriber and list health, segment ranking, email performance and trends, and funnel and automation data — which sign-up forms actually convert.
Compare Claude’s tool list with Flodesk’s documentation. The model’s description of what it can do is a useful starting point, not proof that an operation exists or has the expected permissions.
The metric that was lying to me
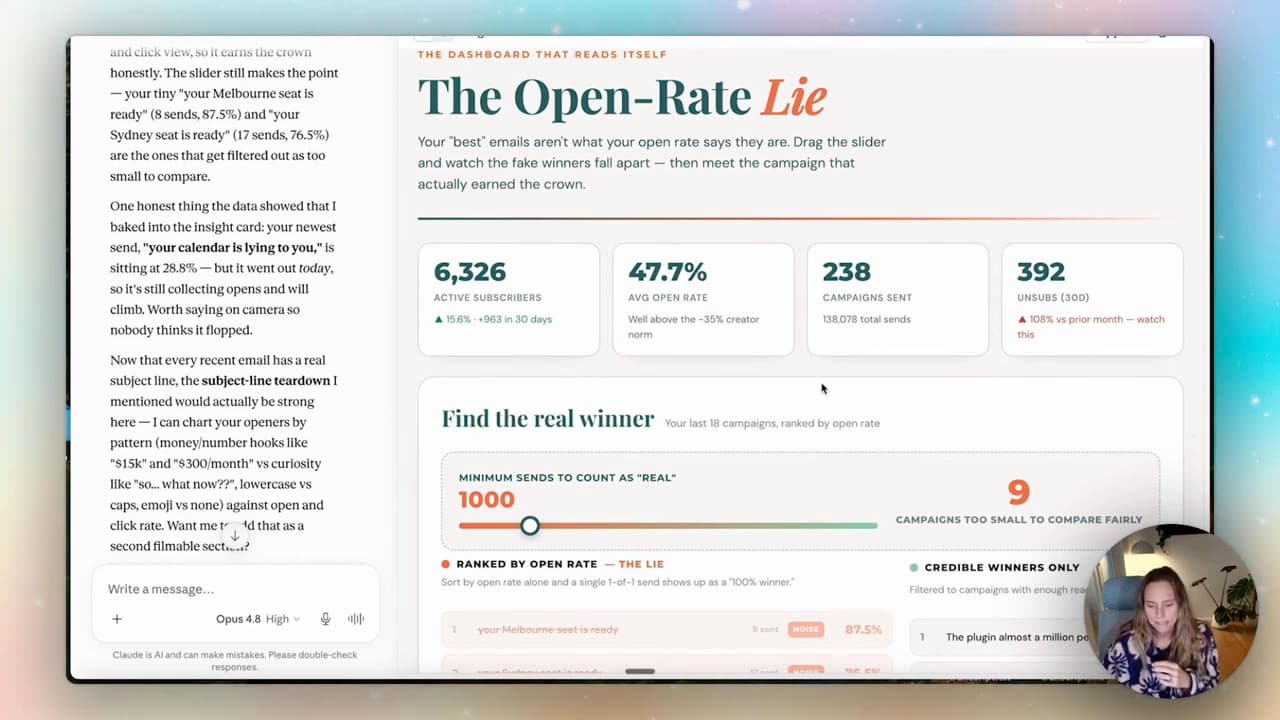
Then I asked it to build me a dashboard. Not a spreadsheet — an actual visual that reads my numbers back to me and tells me what to DO about them.
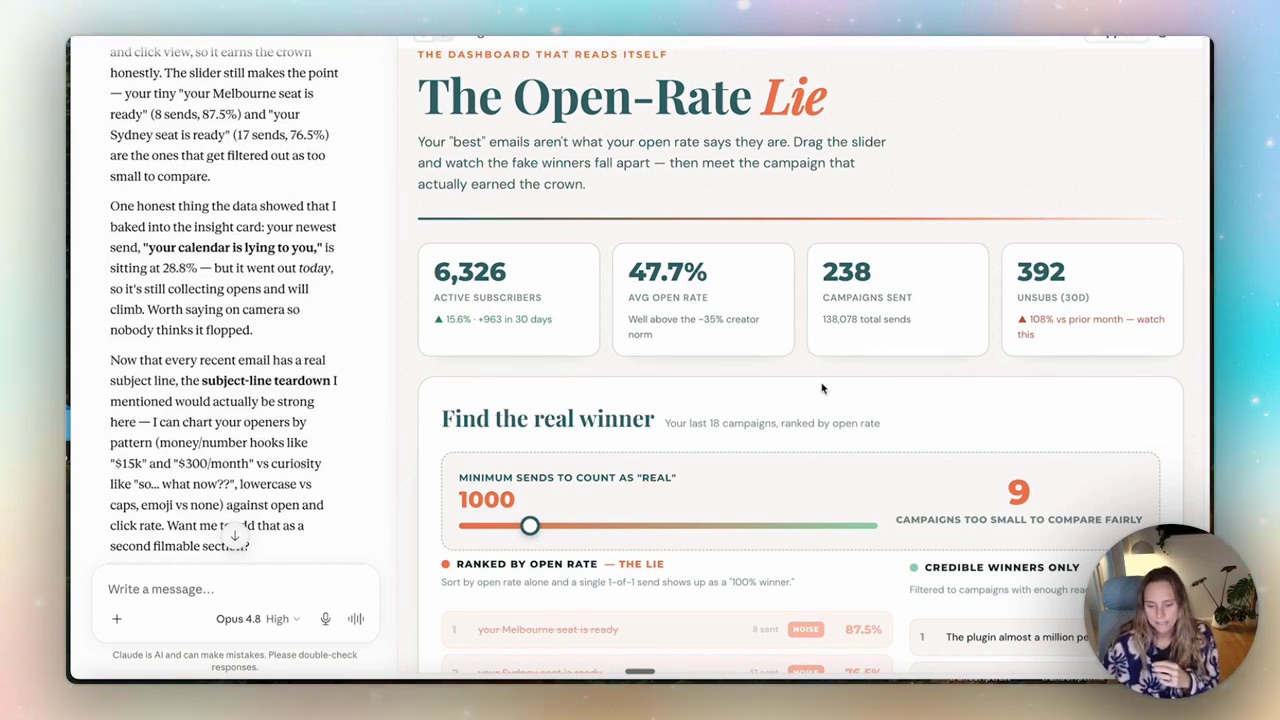
It called the dashboard "The Open-Rate Lie" — and that name earned itself.
Open rate on its own is a vanity metric. It's been unreliable since Apple started pre-loading images, and it makes you feel good (or bad) about the wrong thing. What actually matters is which emails drive clicks and which days your list actually shows up. The dashboard pulled that out for me — the real winner underneath the number I'd been staring at.
It completely changed which emails I'm going to send, and on what days.
Find your best send day
Ask for a table with period, campaign, sent count, delivered count, unique clickers and click rate definition. For example, “unique clickers ÷ delivered” is different from clicks ÷ opens. This is the requested report shape, not a set of measured results. Compare its campaign totals against Flodesk before acting.
The part I use most: a breakdown of open and click behaviour by day of the week.
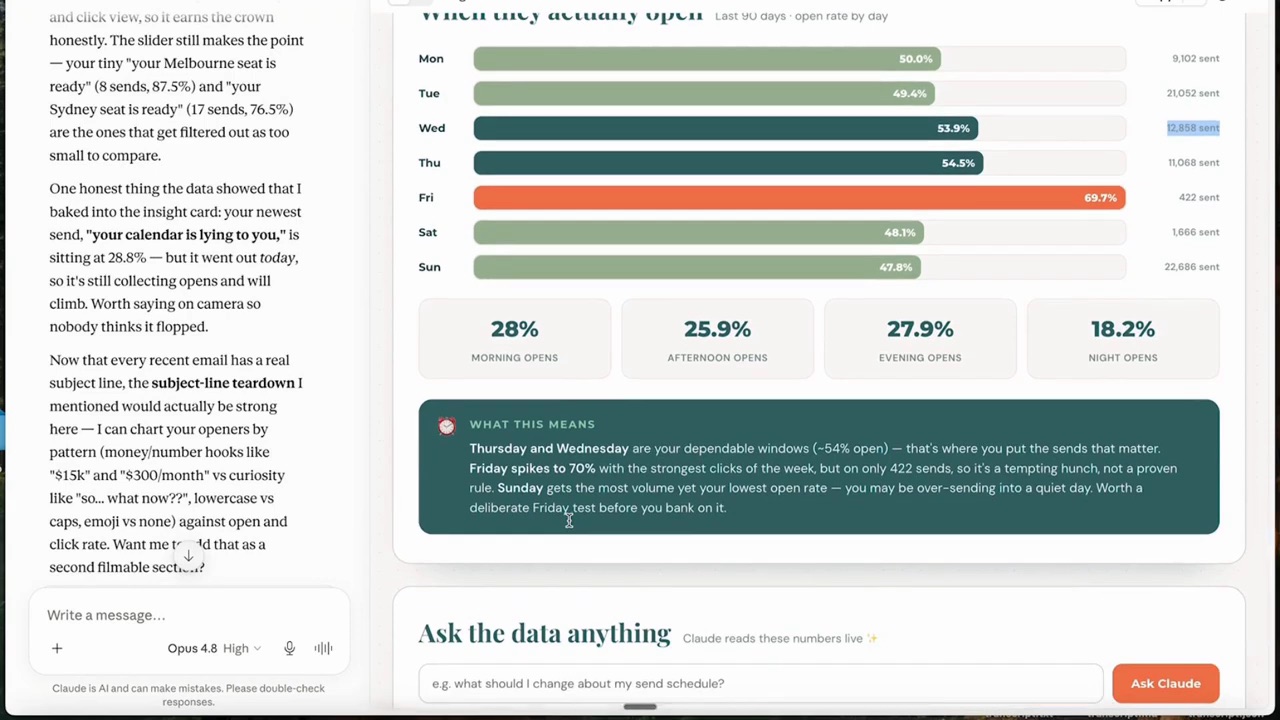
The day-of-week view gives me a test candidate, not a universal best day. Compare similar email topics and audience segments over the same period, and keep the sample size visible. A strong campaign can make a weekday look good by itself.
That's the bit that makes this different from a normal analytics dashboard. It's not a screenshot you have to interpret. It's a thing you can have a conversation with.
FAQ
Do I need to know how to code to connect Flodesk to Claude?
No. The connector is a sign-in flow inside Claude's desktop app — browse connectors, pick Flodesk, log in. There's no spreadsheet, no API key, and no code. If you can log into Flodesk, you can do this.
Is it safe to give Claude access to my Flodesk account?
Review its current permissions. Flodesk documents analytics plus limited subscriber changes; it does not currently send or schedule email through this connector. For this report, use only reading tools and check how your AI account handles the data.
What can Claude actually tell me about my email list?
Subscriber and list health, which segments are biggest, open and click trends over time, and which sign-up forms convert best. The most useful output is a plain-English read on what to change — like the best day to send, or which lead magnet to push harder.
Can I do this with ChatGPT instead of Claude?
Yes. Flodesk documents a ChatGPT connection as well as Claude in the official setup guide above. Check the supported plan and connection method before following the recorded Claude menus.
If your email numbers have been a black box you avoid looking at, this is the fastest way I've found to make them make sense. And if you want to build this kind of thing with support — alongside other women founders actually implementing AI instead of just reading about it — that's what we do inside the Wright Mode membership.